
Figure 2. Selected region of the 1H-15N HSQC NMR spectra of wild type MoPrP.
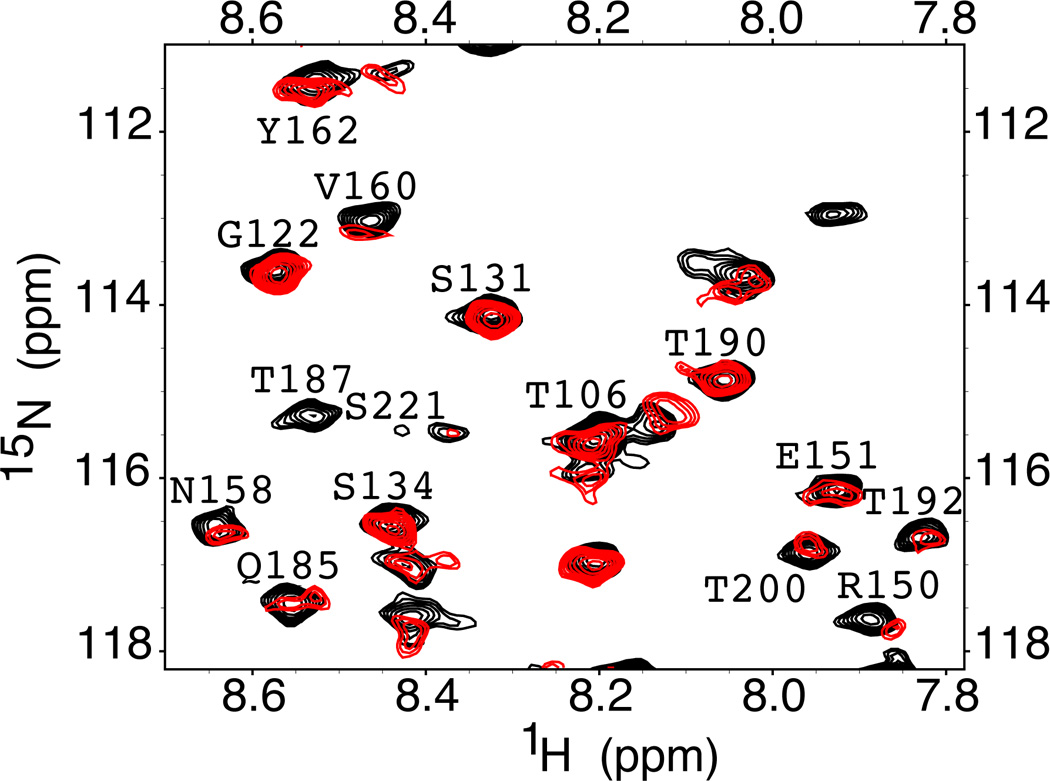
The black spectrum is from the protein in the absence of Zn2+. The red spectrum is from addition of 3 equivalents of ZnCl2 and shows chemical shift changes, and loss or broadening of select cross peaks.