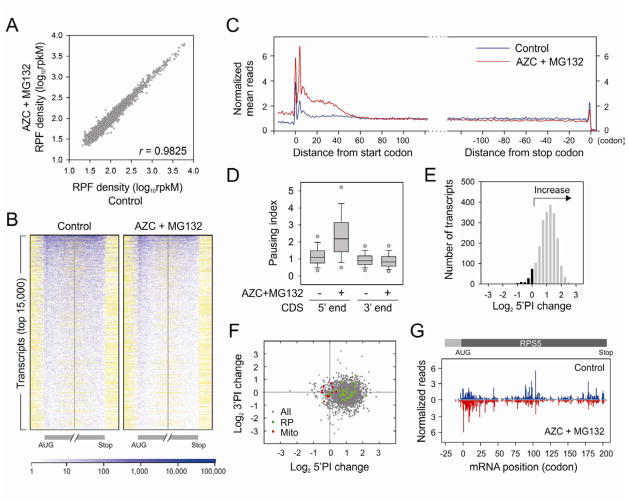
Figure 2. Intracellular proteotoxic stress triggers early elongation pausing of ribosomes.
(A) HEK293cells were treated with 10 mM AZC and 20 μM MG132 for 1 h before ribosome profiling. Ribosome densities of cells with or without treatment are plotted for comparison. The density in reads per kilobase of coding sequence per million mapped reads (rpkM) is a measure of overall translation along each transcript.
(B) Ribosome density heat-maps of cells with or without treatment. The entire transcriptome is sorted based on total RPF reads and the top 15,000 transcripts are aligned in row. Both the first and last 160-codon regions of CDS are shown, together with flanking 40-codon untranslated regions. Reads density is represented in blue. White color indicates regions without reads, whereas yellow for regions without sequence. A short 5′UTR has yellow region before the AUG, whereas a short 3′UTR has yellow region after the stop codon.
(C) Meta-gene analysis of early ribosome pausing of cells with or without treatment. Normalized RPF reads are averaged across the entire transcriptome, aligned at either their start (left panel) or stop (right panel) codon, and plotted as smoothed lines.
(D) Ribosome pausing index (PI) is determined in a 50-codon window at the beginning (5′ end) and end (3′ end) of CDS, respectively. Both the 5′ and 3′ PI of each transcript in cells with or without treatment are shown in box plots with single dots as 5th/95th percentile.
(E) Distribution of 5′PI changes in cells with proteotoxic stress. The log2 change of 5′PI after AZC and MG132 treatment is plotted, with the increase shown in grey bar and the decrease in black.
(F) Changes of 5′PI and 3′PI after AZC and MG132 treatment. The log2 change is computed across the entire transcriptome and presented as a scatter plot with green dots for genes encoding ribosome subunits (RP) and red dots for mitochondria-encoded genes (Mito).
(G) A typical example of early elongation pausing under proteotoxic stress. RPF reads density is shown on the CDS of RPS5 with or without AZC and MG132 treatment. See also Figure S2 – S4.

