Fig3.
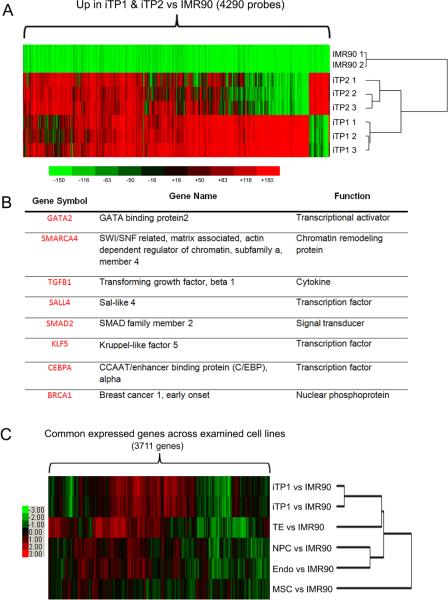
Transcriptome profiling of iTP cells. (A) Heat map of upregulated 4290 probes with 2-fold change or more (P < 0.05) in replicates of iTP1 or iTP2 vs. fibroblasts (IMR90). iTP1 cells and iTP2 cells are tightly clustered when compared with fibroblasts. (B) Eight TS cell-related genes are highly-expressed in iTP cells. (C) Heat map of 3721 transcripts which commonly exist across all examined cells showed that iTP1 cells and iTP2 cells clustered more tightly with human trophectoderms (TE) as compared with human neuron progenitor cells (NPC), mesenchymal stem cells (MSC) or endoderm cells (Endo).

