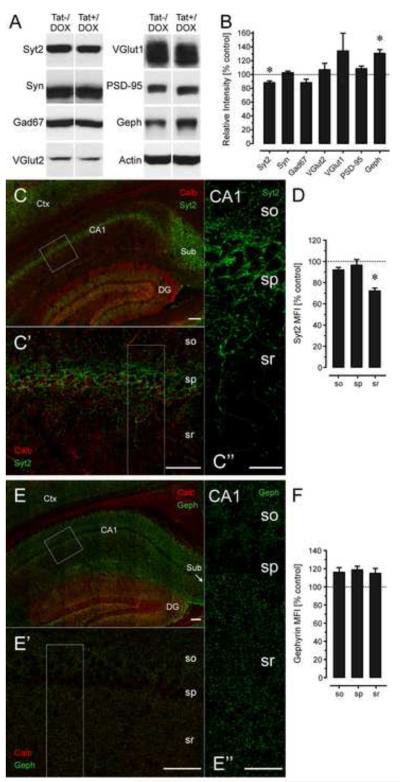
Figure 3.
Effects of Tat induction on levels of synaptic markers by immunoblotting (A-B) and immunohistochemistry (C-F) in the CA1 region of the hippocampus of 3-mo old Tat−/DOX (n = 3) and Tat+/DOX (n = 3) mice. (A-B) Immunoblots demonstrate significant reductions in Syt2 [t(4) = 2.58, p < 0.05] and significant increases in gephyrin [t(4) = 2.24, p < 0.05] levels in Tat+/DOX compared to Tat−/DOX lysates, while levels of Syn, VGlut1, VGlut12, or PSD-95 were not markedly affected when normalized to actin levels. Significant decreases in Syt2 levels with corresponding increases in levels of gephyrin in Tat+/DOX mice suggest that Tat selectively targets inhibitory synapses associated with specific classes of hippocampal interneurons. (C-F) Syt2 (fixed tissue, green, C-D) or gephyrin (fresh tissue, green, E-F) MFI was determined from optical sections double-labeled with calbindin (red). (C-C’’) Syt2+ nerve terminals (green) are specifically present in the stratum pyramidalis of the CA1 region and sparsely distributed throughout the stratum oriens and stratum radiatum. C’ and C’’ are higher magnification images shown in rectangles in C and C’, respectively. (D) The density of Syt2+ nerve terminals was dramatically and selectively decreased for Tat+/DOX mice in the stratum radiatum of CA1 compared to the Tat−/DOX mice [t(4) = 4.00, p < 0.01], while corresponding reductions in Syt2+ terminals were not evident in the stratum pyramidal or stratum oriens. (E-E’’) Gephyrin+ postsynaptic puncta (green) were uniformly distributed throughout the stratum oriens and stratum radiatum, but displaying reduced density in the stratum pyramidalis that coincided with the physical presence of the pyramidal neuron perikarya. E’ and E’’ are higher magnification images shown in rectangles in E and E’, respectively. Although gephyrin MFI shows a decline in the stratum pyramidalis, this was consistent in Tat−/DOX and Tat+/DOX mice such that no relative difference was noted when comparing the two strains (F). Dashed lines represent control levels. Data are mean ± SEM. *p < 0.05; Syt2: synaptotagmin 2; Syn: Synapsin; Gad67: glutamate decarboxylase 67; VGlut1: vesicular glutamate transporters 1; VGlut2: vesicular glutamate transporters 2; PSD-95: postsynaptic density protein 95; Geph: gephyrin; Scale bars = 100 μm in C and E (20x objective), 50 μm in C’ and E’ (63x objective), 20 μm in C’’ and E’’ (63x objective); CA1: Cornu ammonis 1 region; DG: dentate gyrus; so: stratum oriens; sp: stratum pyramidalis; sr: stratum radiatum; calb: calbindin; MFI: mean fluorescence intensity.

