
Figure 2.
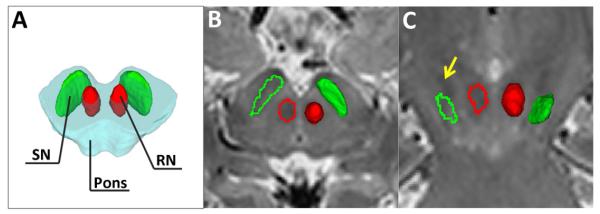
Relative location of the substantia nigra (SN) and red nucleus (RN) on a schematic of the midbrain (A). A typical MRI image illustrates the location of the SN (green) and RN (red) in T2-weighted images (B) and the co-registered regions on the R2* (C) map in an axial section.