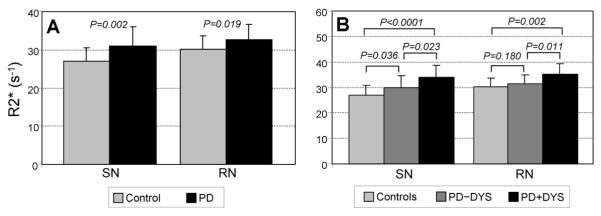
Figure 3.

Mean SN and RN R2* values (± SD) for Control and PD subjects. (3A) In both the SN and RN, PD subjects had higher R2* values compared to control subjects. (3B) In both the SN and RN, PD subjects with a history of dyskinesia (PD+DYS) had higher R2* values compared to both control subjects and PD subjects without a history of dyskinesia (PD−DYS). PD−DYS subjects showed significantly higher R2* values in the SN compared to Controls, but this comparison did not reach significance in the RN.
