
Figure 2. Comparison of the pathway analysis results from dbPTB genes and from genome wide analysis.
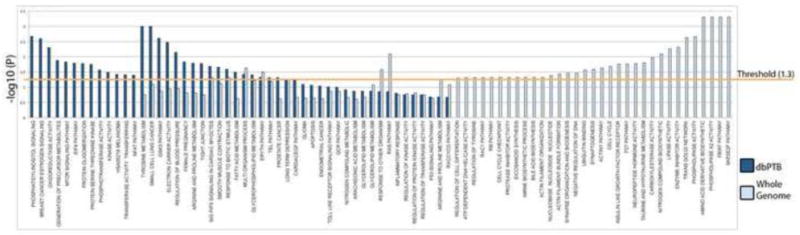
The Vertical axis represents the −log P values for each the pathways. The statistical values for dbPTB are shown in dark blue bars and for the whole genome analysis are shown in light blue bars. Each of the pathways are shown along the horizontal axis. The threshold value of −log P= 1.3 corresponds to an FDR p value less than 0.05 which has already been corrected for the multiple comparisons.