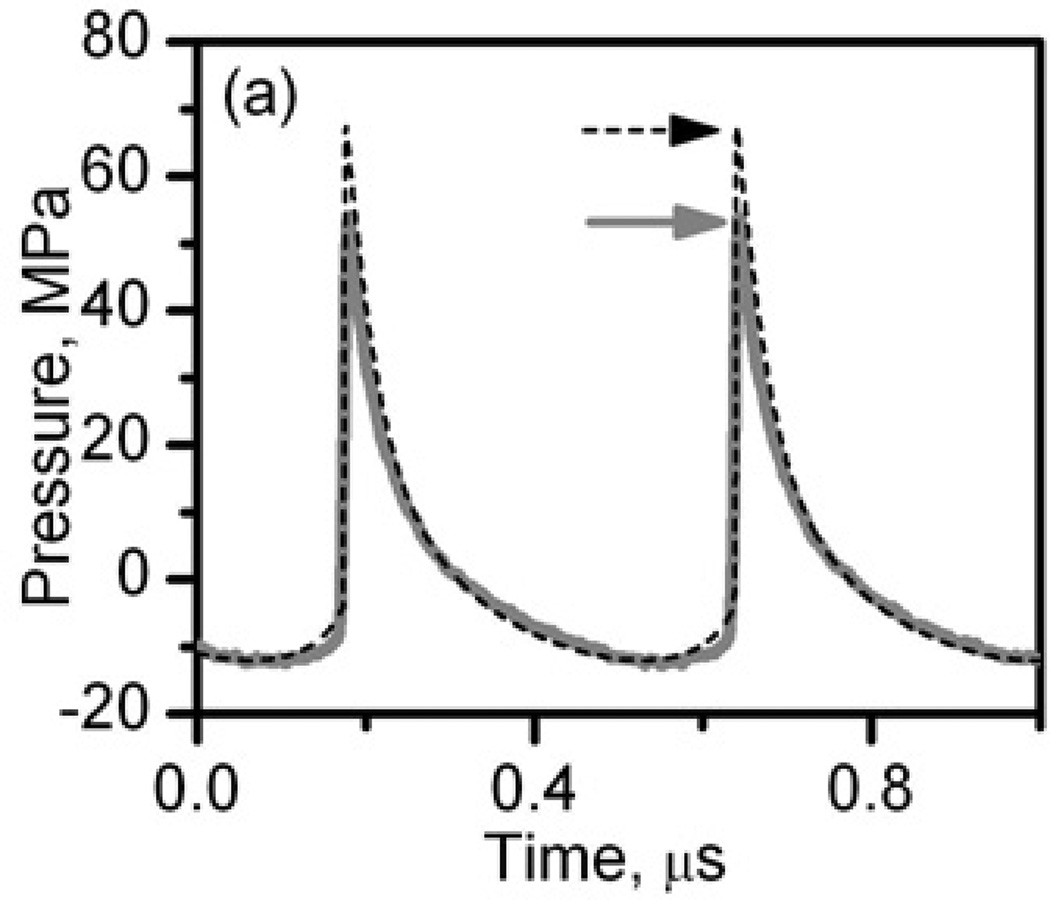
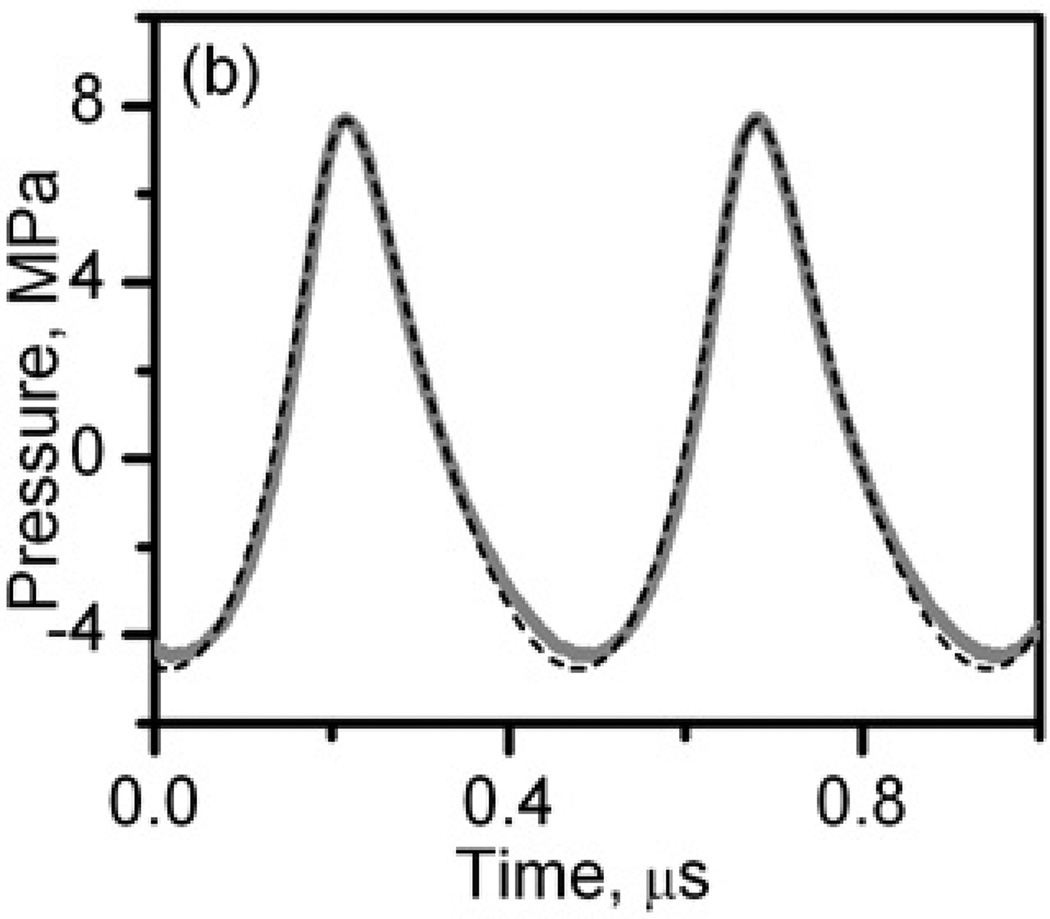
Figure 2.
In situ HIFU waveforms at the power output levels used to produce liquid, paste, and vacuolated thermal lesions (a) and solid thermal lesions (b). The waveforms were measured by the FOPH behind a 12-mm thick layer of bovine heart tissue (thick grey curves) and modeled using the KZK equation and nonlinear derating approach (black dashed curves) (Khokhlova et al. 2011a).


