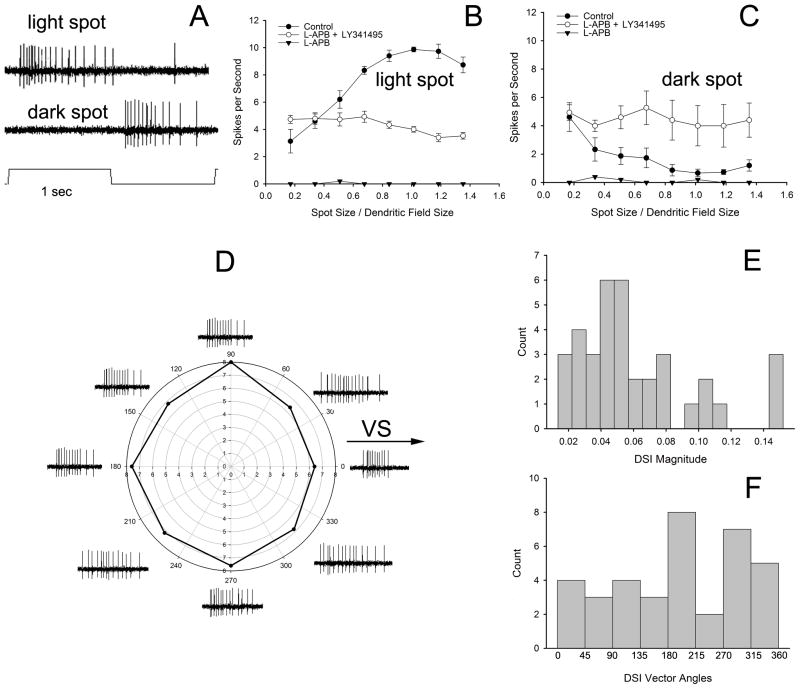
Figure 8.
(A) A light spot centered on a ON bistratified ganglion cell and covering the receptive field produced spiking only to the onset of the stimulus, while a dark spot of the same size caused spiking only at stimulus offset. (B) Light spots of increasing diameter produced a receptive field with a maximal response near the dendritic field size. The mGluR6 agonist L-APB (25 μM) abolished all light-driven activity; combining L-APB with a mGluR6 antagonist LY341495 (50 μM) restored spiking activity with no light-driven component. (C) The onset of dark spots of increasing diameter produced little stimulus-driven activity. L-APB abolished almost all spiking. LY341495 restored spiking, but did not unmask any stimulus-driven activity hidden by mGluR6-mediated ON bipolar cell activity. (D) Representative responses of a ON bistratified ganglion cell to light bars moving in 8 different directions. The arrow shows the direction with respect to of the visual streak. A polar plot of these responses reveals little directional preference; the vector magnitude = 0.031 with an angle of 185°. The diameters of the concentric circles represent spikes/sec. Movement toward the visual streak is 0°. (E) The magnitude of the directional responses averaged only .061 (s.d. = 0.037), while the vector angles (F) did not show clearly defined clusters in a few cardinal directions. Responses in (B) and (C) are the averages of 4 cells from 6–8 mm inferior to the visual streak and with dendritic fields from 605–665 μm in diameter.

