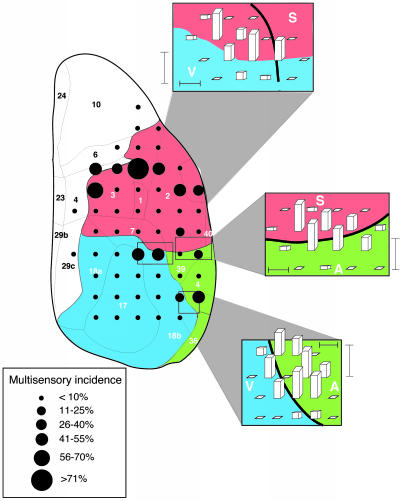
Fig. 1.
The distribution of multisensory neurons in rat sensory neocortex. The line drawing depicts the dorsal surface of cortex. Numbers and solid lines designate major subdivisions (17) (parietal, red shading; temporal, green shading; and occipital, blue shading). Filled circles show locations of electrode penetrations in a coarse-grain analysis that was conducted in 22 animals, and circle size indicates the relative incidence of multisensory neurons at each site. Insets show the results of higher-resolution sampling through each of the transitional regions that was conducted in a total of nine animals. Bar height indicates the relative incidence of multisensory neurons. Horizontal scale bar = 250 μm, and vertical scale bar = 50% multisensory incidence. V, visual cortex; A, auditory cortex; S, somatosensory cortex.

