Figure 1.
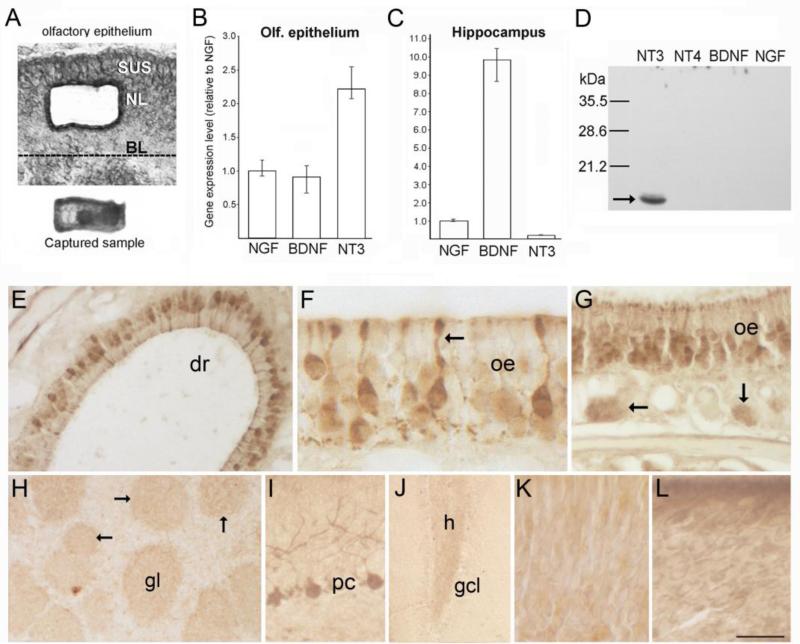
(A) Photomicrographs of a section through the olfactory epithelium (top) showing the location where cells were isolated by laser microdissection, and the captured cell sample (bottom) as seen on the collection cap. (B-C) Bar graphs showing normalized Q-RT-PCR results obtained from laser-captured OSN samples (B, 45ng total RNA per assay), and dissected hippocampus (C, 20ng total RNA per assay). Mean NGF transcript levels are set to 1.0. Bars indicate mean values calculated for multiple assays, and error bars indicate the range of values obtained across multiple assays for each transcript, rather than statistical error (n=6). (D) Western blot of recombinant neurotrophin peptides (1 μg/lane) demonstrating the specificity of the NT3 antibody. (E-G) Immunostaining for NT3 in the olfactory epithelium (oe). The arrow in F indicates a sensory neuron dendrite, and the arrows in G indicate bundles of more lightly stained sensory axons below the epithelium. (H) In the olfactory bulb, faint staining occurs in the neuropil of glomeruli (gl, and arrows). (I-J) Images showing stained Purkinje cells in cerebellum (I), and more faintly, mossy fibers in the dentate gyrus (J). (K-L) Incubation with pre-absorbed antibody (K) or with pre-immune serum (L) produces non-specific staining in the olfactory epithelium. BL, basal lamina; NL, neuronal layer; SUS, sustentacular cell layer; dr, dorsal recess; gcl, dentate granule cell layer; h, hilus. Bar in K= 40μm in A, 60μm in E, 18μm in F, 41μm in G, 130μm in H, 50μm in I, 100μm in J, and 17 μm in K-L.

