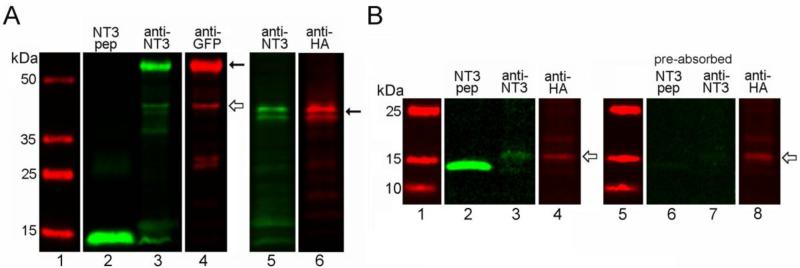
Figure 2.
In vitro expression of NT3 fusion proteins. (A) Western blots of lysates (15μg protein, lanes 3-6) from infected COS7 cells obtained with Santa Cruz NT3 antibody confirming expression of NT3-GFP (left panel, Santa Cruz anti-GFP), and NT3-3xHA (right panel, Covance anti-HA). Lanes 1 and 2 show molecular weight markers and the signal obtained with 100ng of mature, hrNT3 (control peptide), respectively. Solid arrows indicate the proforms of the tagged trophic factor, and the open arrow indicates a smaller band for mature NT3-GFP. Multiple bands seen for proNT3-3xHA reflect variable glycosylation of the protein. (B) Western blots of COS cell lysates (45μg protein, lanes 3-4) obtained with our rabbit NT3 antibody and Covance mouse anti-HA, showing bands for mature NT3-3xHA (open arrows). Lane 1 shows molecular weight markers and lane 2 shows the signal obtained with 30ng of hrNT3 control peptide. Control lanes (6-8) demonstrate that preabsorption of the NT3 antibody with hrNT3 eliminates detection of hrNT3 (30ng, lane 6) and HA-tagged mature NT3 (lane 7), while the HA epitope is still detected (open arrow, lane 8).

