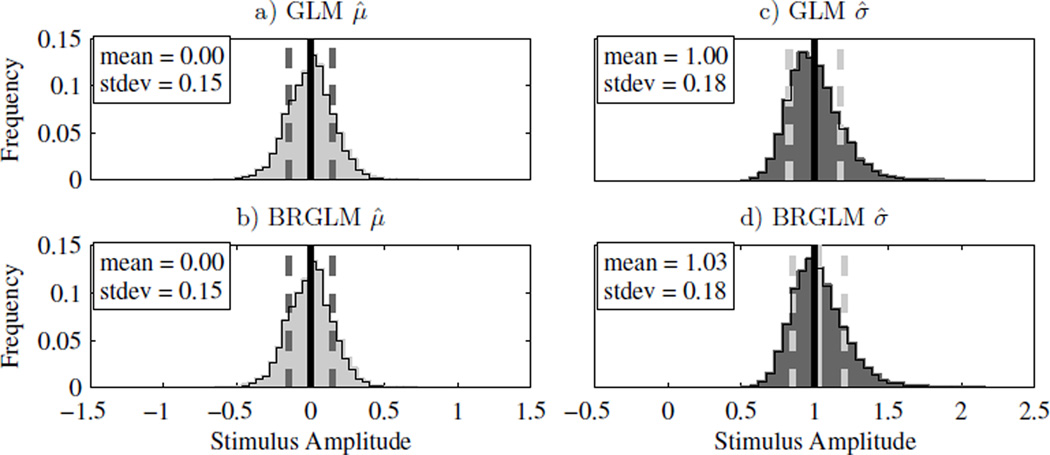
Fig. 4.
GLM and BRGLM μ̂ and σ̂ distributions for a non-adaptive sampling procedure with n = 100 trials, μ = 0 and σ = 1. Panels a) and c) show the histograms for μ̂ and σ̂ using GLM fits. Panels b) and d) show the histograms for μ̂ and σ̂ using BRGLM fits. The solid black line is the actual parameter value, the solid gray line is the mean of the parameter estimates, and the dashed gray lines indicate one standard deviation either side of the mean

