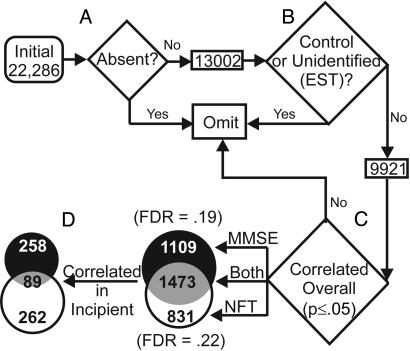
Fig. 1.
Gene identification algorithm. (A) Genes rated absent (see Methods) were excluded from analysis. (B) Only annotated probe sets (not expressed sequence tags) were included in the statistical analysis. (C) Pearson correlation was performed for every gene against both MMSE and NFT measures of each subject. Venn diagram shows the number of genes significantly correlated (P ≤ 0.05) with both MMSE and NFT or either index alone. For each index, the false discovery rate (FDR) was calculated. (D) For the genes found to correlate significantly across all subjects (overall, n = 31), another Pearson's correlation was performed post hoc among only the subjects rated either “Control” or “Incipient” (Incipient, n = 16).

