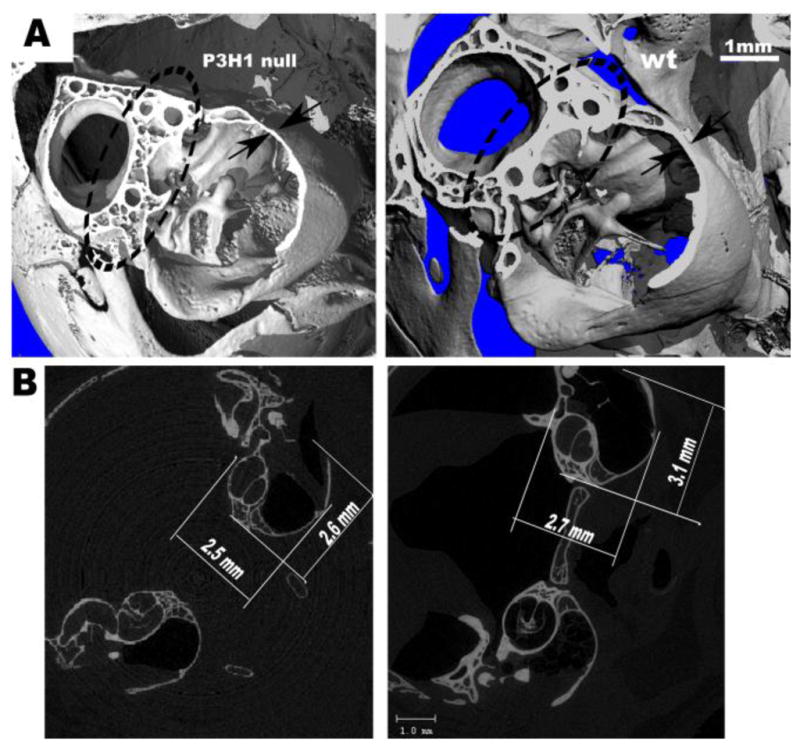
Figure 2. Micro-CT scans of P3H1 null and wild type control ears.

Panel A represents a 3-D reconstructed cut section of the P3H1 null and age-matched wild type control temporal bones. Arrows indicate the measurements of the temporal bone thickness (0.07 mm for mutant, and 0.11 mm for wild type). Note more porous bone in the circled area for the null.
Panel B shows corresponding 2-dimentional crossections. Temporal bone of the P3H1 tend to be less elongated compare to the control (measurements are indicated on the figure).
