Figure 7.
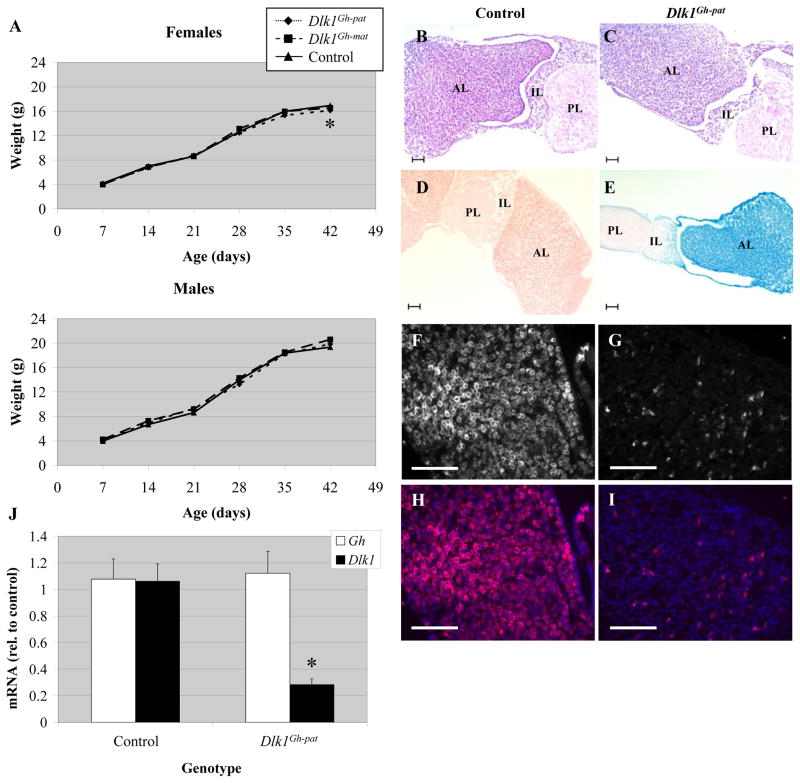
Growth rates, pituitary morphology and Gh expression of Dlk1Gh mice. A) Weight of control (solid line, triangles), Dlk1Gh-pat (dotted line, diamonds), and Dlk1Gh-mat (dashed line, squares) mice from 7 to 42 days of age. n ≥ 11 for each data point. * denotes p < 0.05 for Dlk1Gh-pat mice. B, C) H & E stained sections of pituitaries from adult control (rGh-Cre/+) (B) and Dlk1Gh-pat (C) Mice. D, E) β-galactosidase activity in pituitaries from adult ROSA26/+; +/+ (D) and ROSA26/+; +/rGh-Cre (E) mice. AL indicates anterior lobe, IL, intermediate lobe, and PL, posterior lobe. F-I) Immunohistochemistry using an antibody for DLK1 in adult control (rGh-Cre/+) (F, H) and Dlk1Gh-pat anterior pituitaries (G, I). Images are shown in black and white for DLK1 alone (F, G) and in color with DLK1 (red) and DAPI (blue) merged (H, I). Scale bars in B–I equal 100 μm. J) qRT-PCR for Gh and Dlk1 expression in adult Dlk1Gh-pat pituitaries relative to the average of control values. Error bars represent SEM, * denotes p < 0.05.

