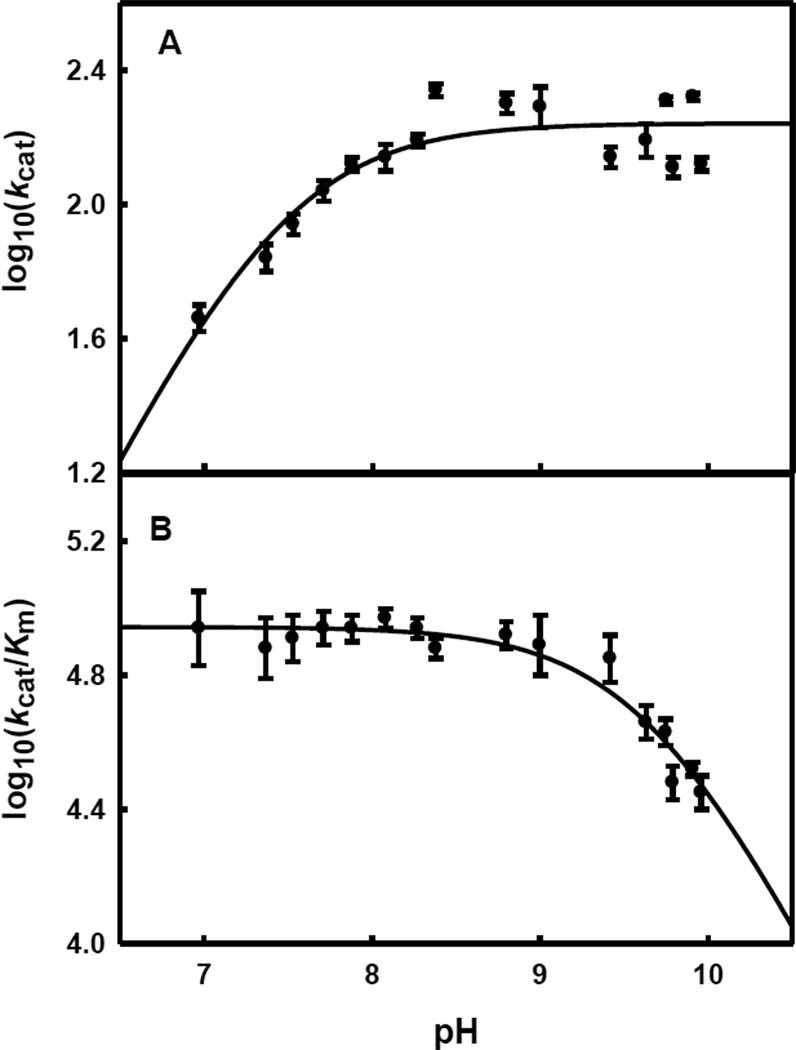
Figure 3.
pH-Rate profile for the hydrolysis of histidinol phosphate by HPP from L. lactis at 22 ± 1 °C. (A) Variation of log kcat/Km versus pH. The solid line represents a fit of the data to equation 4. (B) Variation of log kcat versus pH. The solid line represents a fit of the data to equation 3.

