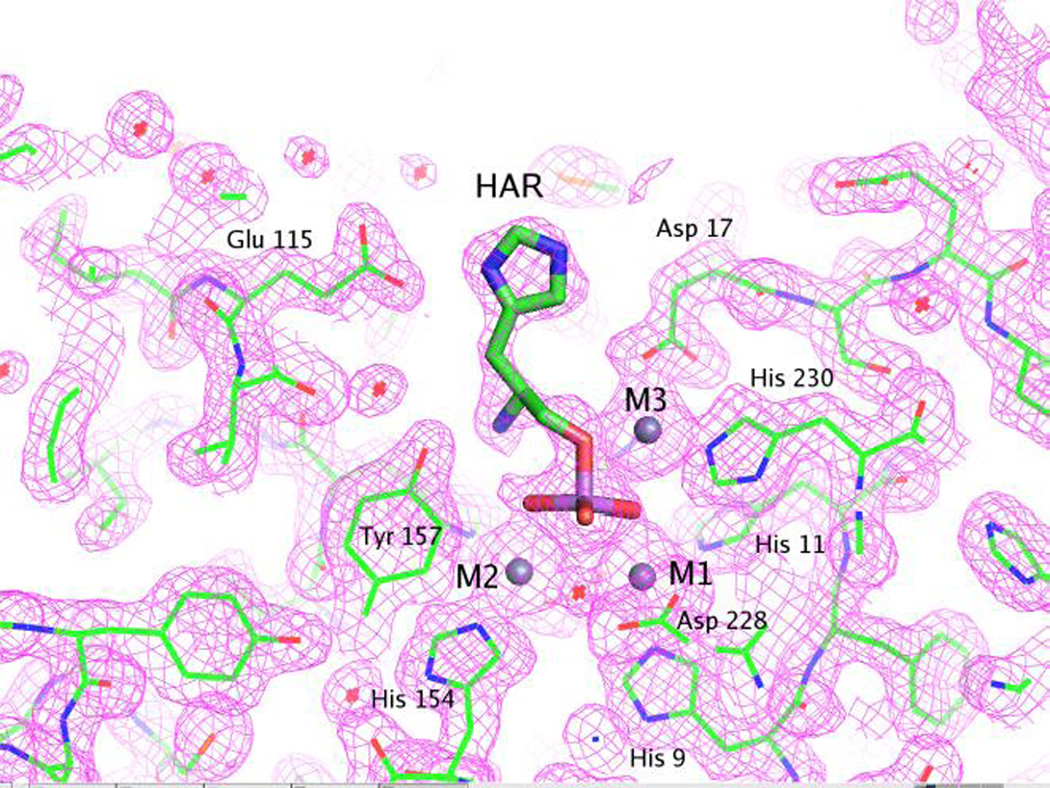
Figure 7.
Representative electron density map for the active site of the HPP complexed with Zn2+ and l-histidinol arsenate and contoured at 1.5σ. The figure was produced with PyMOL (26). The details of the interactions between l-histidinol arsenate and the active site are described in the text.

