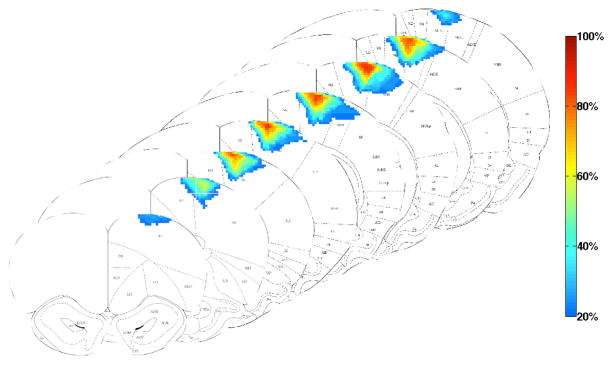
Figure 8.

Graphical representation of the volume, topography and shape of strokes from the entire group, overlaid on coronal diagrams from the Paxinos atlas of the rat brain. The lesions spanned from AP 4.2mm to −1.8mm. The color gradient represents the percentile (frequency of occurrence) of the stroke lesion volume.
