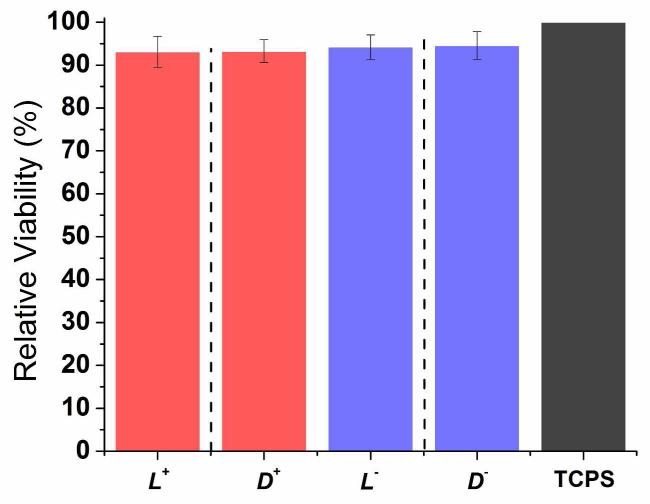
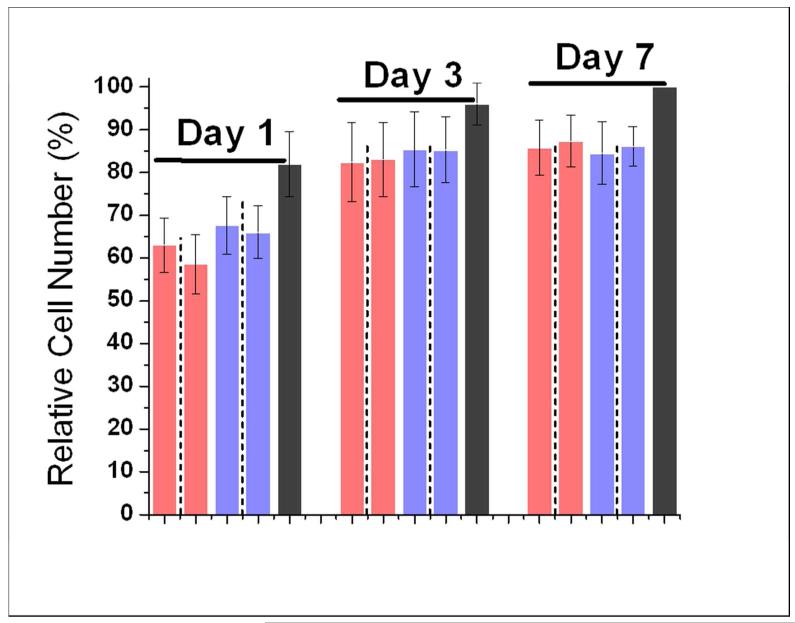
Figure 2.
(A) Relative hMSC viability on TCPS in the presence of single oligopeptides 24 hours after cell seeding. (B) hMSC cell number percentage on TCPS in the presence of single oligopeptides at 1, 3 and 7 days after seeding. Bar order and colors in (B) correspond to the same order and colors in (A). Adjacent bars separated by dashed lines are a pair of mirror images. For (A), results were normalized to TCPS. For (B), results were normalized to TCPS day 7. For both graphs, errors are expressed as the standard error of the mean (SEM).


