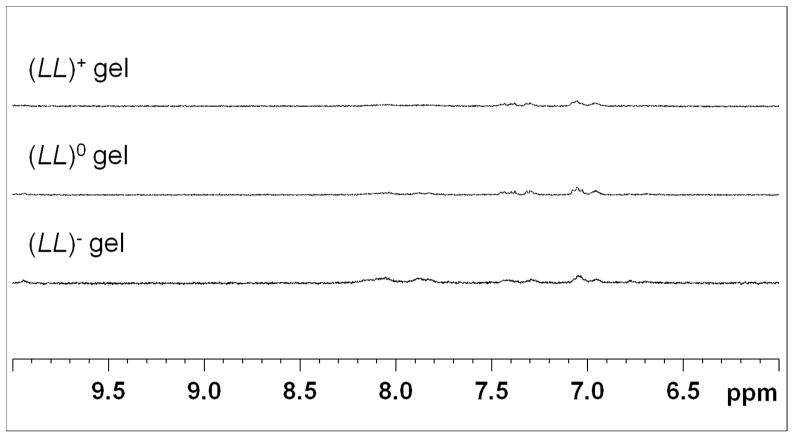
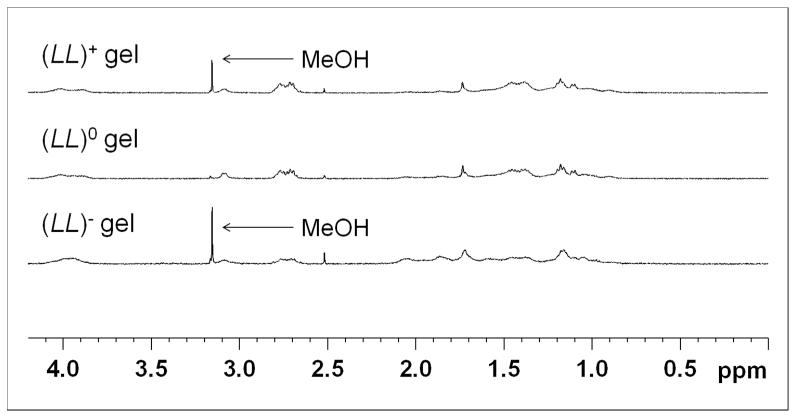
Figure 5.
1D 1H NMR spectra for (LL)+ gel, (LL)0 gel and (LL)− gel plotted on the same scale. The figure is divided into two parts to exclude the unsuppressed portion of the H2O peak around 4.75 ppm. The left panel is the aromatic region and the right panel is the aliphatic region. Here, the peak heights for all three gels very similar and small, indicating a lack of free oligopeptide present in the gels after 24 hours. Peak heights were calibrated using the proton signal from TSP (9mM proton concentration). Trace amount of MeOH comes from the peptide purification procedure, which uses MeOH as an eluent.


