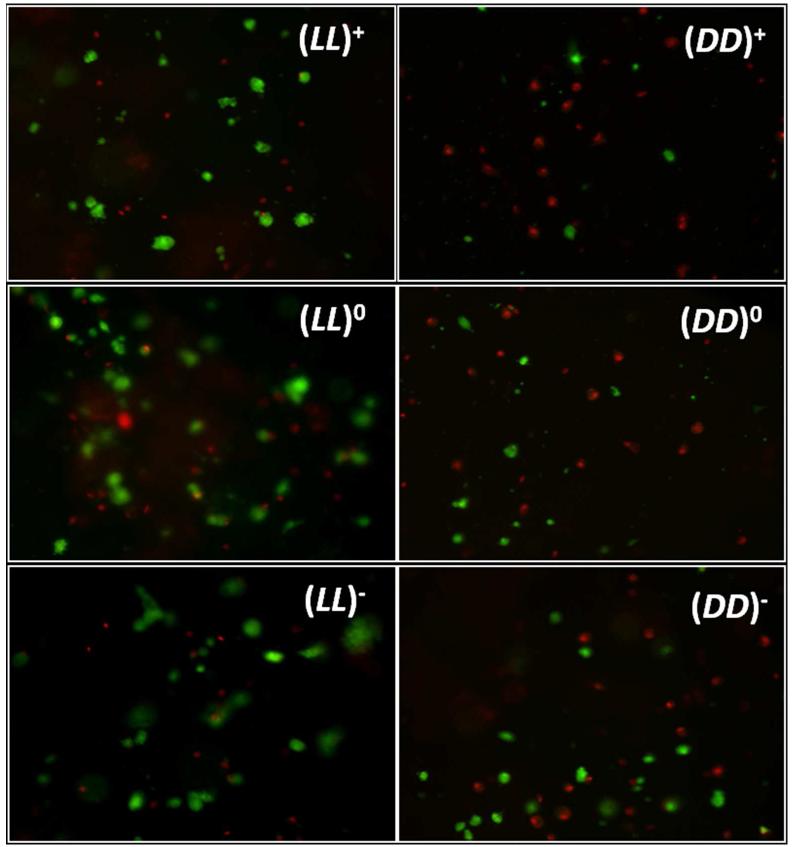
Figure 7.
Representative live/dead images for charged and neutral homochiral gels at 1 day after cell seeding. Live hMSCs are green and dead hMSCs are red. Cell size is much larger and image clarity is much cloudier for LL images when compared with DD images. These images indicate cell penetrating into LL gels, but not into DD gels.

