
Figure 3.
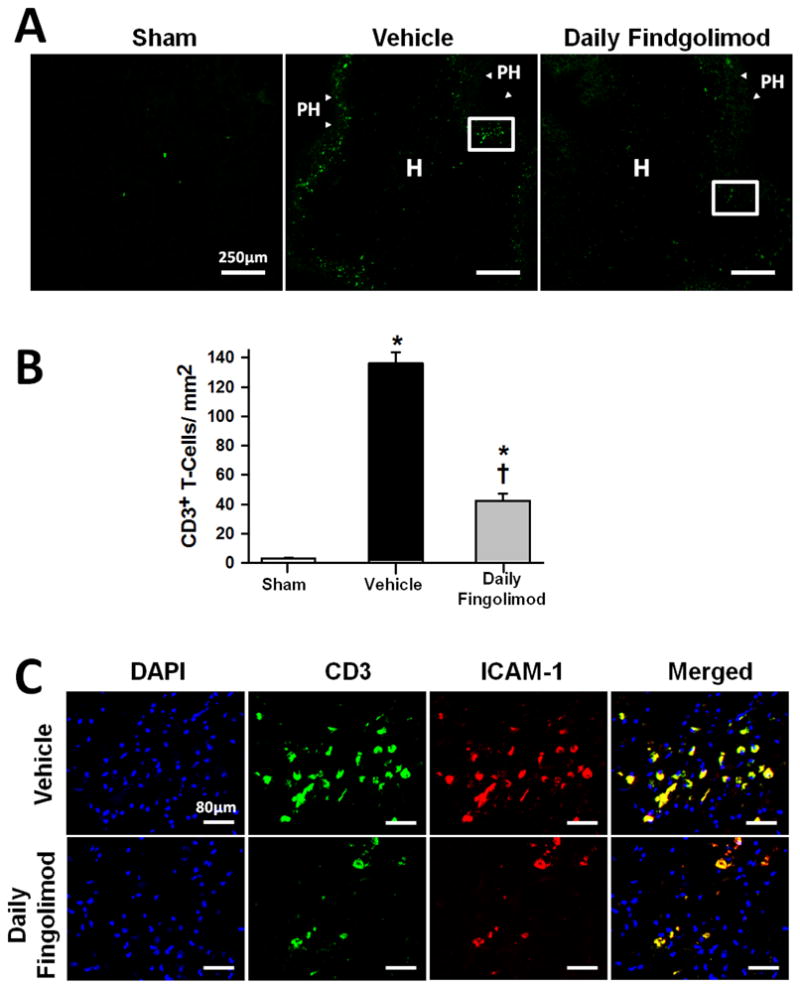
Effect of daily fingolimod treatment on brain infiltration of T-lymphocytes at 72 hours after cICH-induction or sham surgery in mice (A). Representative photomicrographs showing CD3 positive cells (arrow heads) infiltrating the perihematomal (PH) area, and to a lesser extent the hemorrhage (H) site. White box depicts the area magnified below. Bar graph showing CD3 positive cell quantification (B). Representative photomicrographs showing CD3 positive cells (green) with ICAM-1 (red) co-localization. DAPI nucleic acid stain (blue) marked DNA (C). Data in bar graphs are expressed as mean ± SEM. N=5 mice per group. * p<0.05 compared to sham, † p<0.05 compared to vehicle.