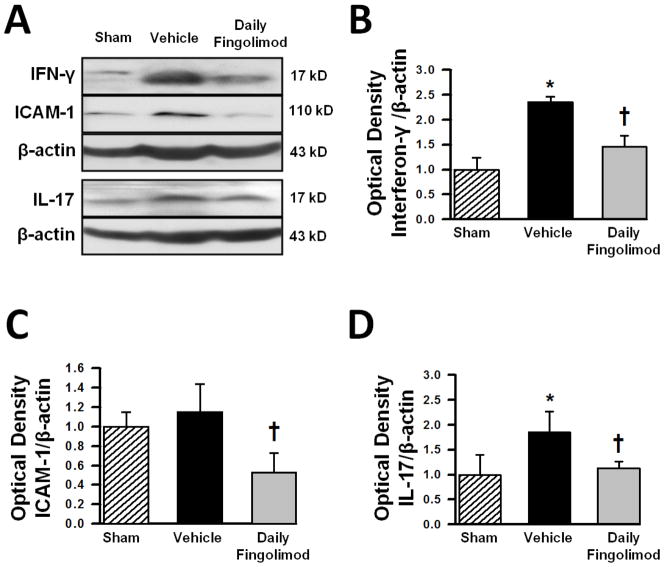
Figure 4.
Representative Western blots (A) and bar graphs showing densitometric quantifications of the inflammatory markers interferon gamma (IFN-γ) (B), inter-cellular adhesion molecule-1 (ICAM-1) (C), and interleukin 17 (IL-17) (D) at 72 hours after cICH-induction or sham surgery. The band density values were calculated as a ratio of β-actin, normalized to sham. Data are expressed as mean fold change ± SEM. N=6 mice per group.* p<0.05 compared to sham, † p<0.05 compared to vehicle.

