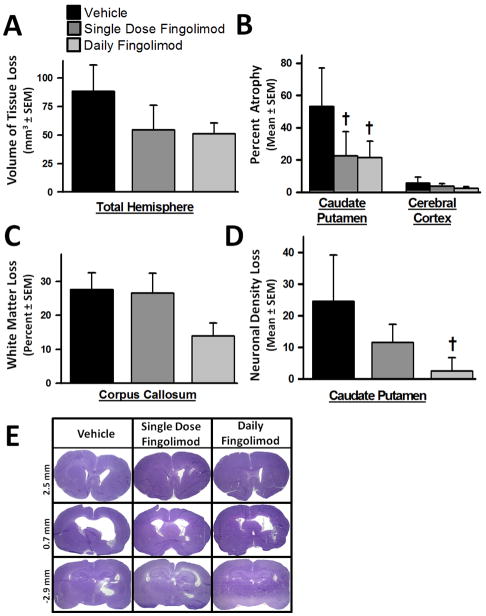
Figure 7.
Effects of single or daily fingolimod treatment on cerebral histopathology at 10 weeks after cICH-induction in rats. Bar graph showing total tissue loss of the ipsilateral brain hemisphere (A). Bar graph showing percent atrophy of the caudate putamen and cerebral cortex based on the volumetric difference of the contralateral side (B). Bar graph showing white-matter loss measured as percent volumetric difference of the corpus callosum between the ipsilateral and contralateral hemispheres (C). Bar graph depicting loss of neuronal density in the ipsilateral caudate putamen reported as the difference in cell counts between ipsilateral and contralateral regions (D). Representative microphotographs of Nissl stained brain sections illustrating ventriculomegaly at 10 weeks following cICH-induction (E). Values are expressed as mean ± SEM. N=7 rats per group. † p<0.05 compared to vehicle.

