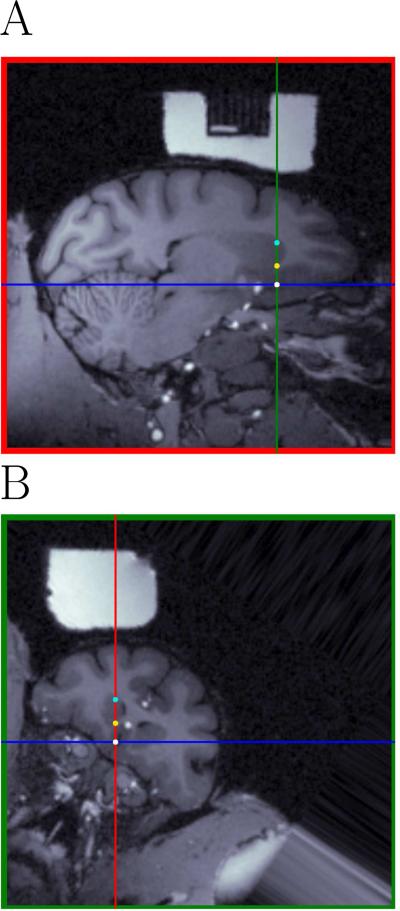
Figure 5.
Chamber-oriented views centered at the electrode tip (panels A-B). The intersection between the green and the blue lines in panel A and the blue and the red lines in panel B represents the position of the targeted neural area (vmPFC). Turquoise dots represent the location of the first recorded unit in the caudate (depth: 9.85 mm) and yellow dots represent the position at which the experimenter decided, based on the pattern of neurophysiological responses, that the electrode was outside the caudate (depth: 15mm). The white dot represents a unit recorded in vmPFC. The MRI reference grid appears as the dark rectangle in A. The recording chamber appears as the white material surrounding the reference grid in A, and as the white block in B. Note that this electrode track is outside the MRI reference grid, because the reference grid was smaller than the single neuron recording grid.

