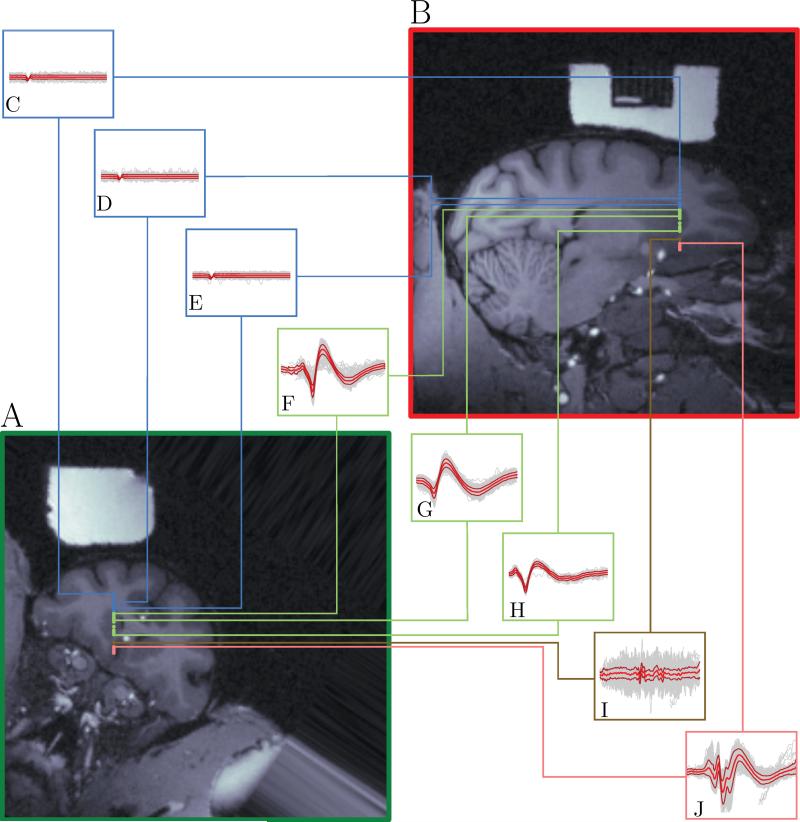
Figure 6.
Demonstration of recordings at different depths mapped onto the MRI. Panels A and B are aligned with the chamber coordinate system. Blue dots represent depths at which only background activity was observed (no neurons). Green dots represent depths at which caudate neurons were recorded. Brown dots represent the depth at which axonal activity was recorded. Pink dots represents depths at which vmPFC neurons were recorded. Panels C-J represent the activity at the depth corresponding to the linked colored dot. Gray lines represent single activity traces, magenta lines the mean activity and red lines the standard deviation around the mean. Depths. C: 5.00 mm. D: 7.00 mm. E: 9.00 mm. F: 9.85 mm. G: 11.5 mm. H: 15.00 mm. I: 17.00 mm. J: 19.00 mm. All traces had the same threshold and the same height (4 mV). Boxes A-H have a width of 2.5 ms, box I has a width of 5.625 ms and box J has a width of 4.5 ms.

