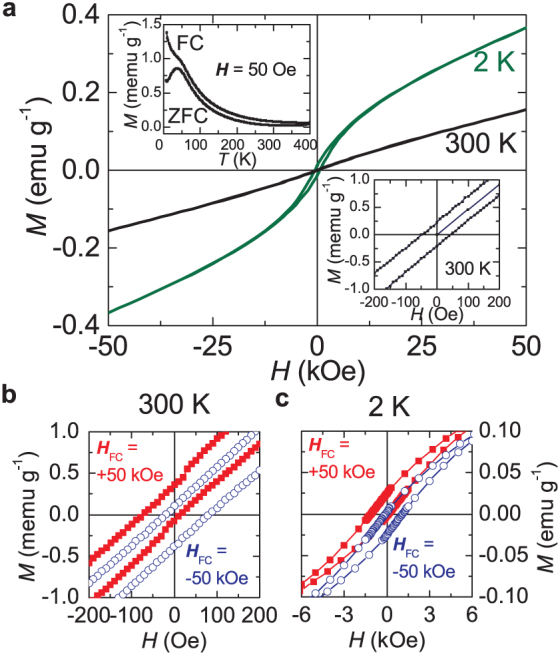
Figure 4. Magnetic properties of the Bi4.2K0.8Fe2O9+δ nanobelts.

(a), the M–H curves of the nanobelts at 300 K and 2 K. The top inset shows the temperature dependencies of ZFC and FC magnetizations at 50 Oe, and the bottom inset represents an enlarged view of the M–H curve at 300 K. (b–c), exchange bias effect in Bi4.2K0.8Fe2O9+δ nanobelts at 300 K (b) and 2 K (c), respectively. The M−H curves are measured in a field cooling model with the cooling fields HFC = +50 kOe (red solid square) and −50 kOe (blue open circle), respectively.
