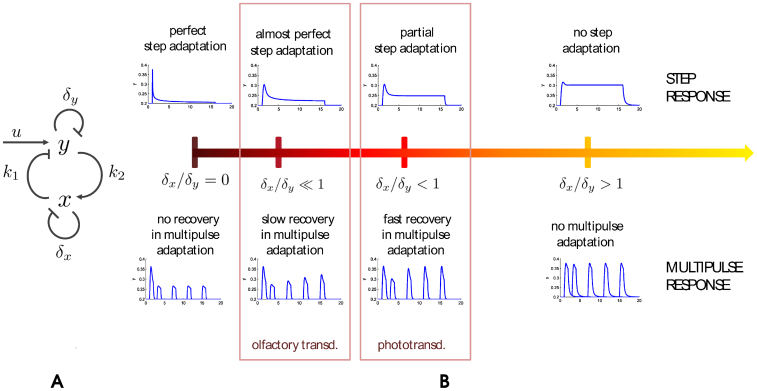
Figure 1. Step and multipulse adaptation.
(A) The basic model (1) consists of the two variables y and x linked by a negative feedback loop (of gains k1 and k2), an external input u, and two first order degradation terms (of rates δx and δy). (B) Various levels of adaptation for the model (1), according to the ratio δx/δy. The upper and lower parts of the panel show the response to the two main input protocols described in the text, steps and multiple pulse pairs (here a series of 4 pulse pairs in which the second pulse is progressively delayed with respect the first; the 4 double pulse responses are shown all simultaneously, and the 4 first pulses of each pair are all identical and overlapping). Notice that the step responses resembles those of Figure 5 of Koshland et al.11. The ratio δx/δy determines the amount of the two forms of adaptation mentioned in the text, step adaptation and multipulse adaptation. In particular perfect step adaptation requires exact integral feedback (i.e., δx = 0) and corresponds to no recovery in multipulse adaptation (leftmost plots). Moving from left to right of the panel as we increase the ratio δx/δy, step adaptation decreases and the recovery in multipulse adaptation becomes faster. See Supplementary Figure S1 for blown-up plots of the various cases.

