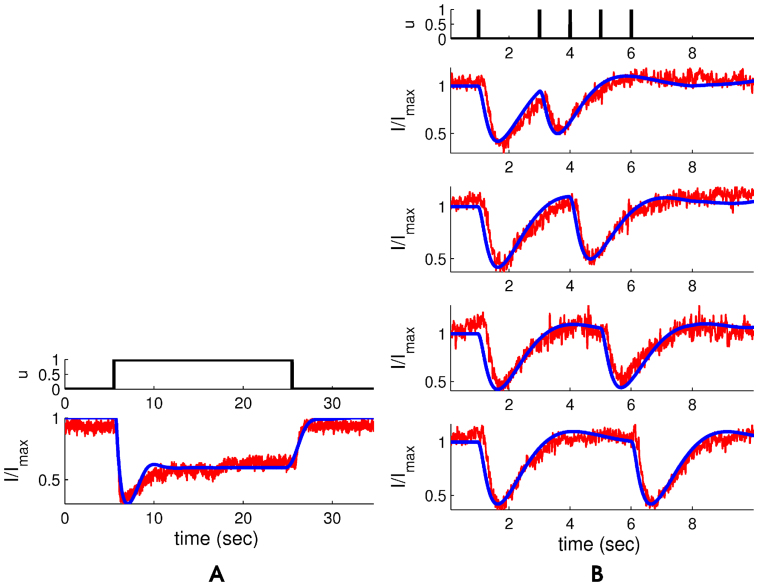
Figure 3. Phototransduction.
(A) The red traces show an example of normalized response to a step sustained for 20 s in non saturating light conditions. The blue traces show the response of the dynamical model (S11) described in the Supplementary Information. (B) Example of normalized response from two identical non saturating light pulses with a duration of 5 ms applied with a time interval Δt of 2, 3, 4, and 5 s respectively (red traces). In blue the fit of the dynamical model (S11) is shown. Experiments were performed with light at wavelength 491 nm and with suction-electrode recording method from two isolated and intact Xenopus laevis rods (one for panel A and one for panel B) in dark-adapted conditions.

