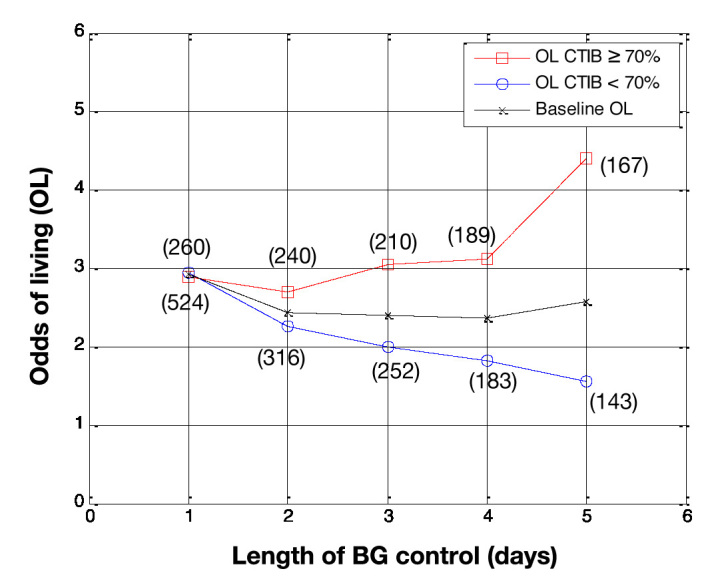
Figure 3.

Odds of living by day for all patients in the study (N = 784 on day 1). Patients with at least 70% of BG measurements inside 72–126 mg/dl (squares) are compared with patients with less than 70% of BG measurements in 72–126 mg/dl (circles), with baseline OL shown for comparison (crosses). The number of patients in each subcohort is shown in parentheses.
