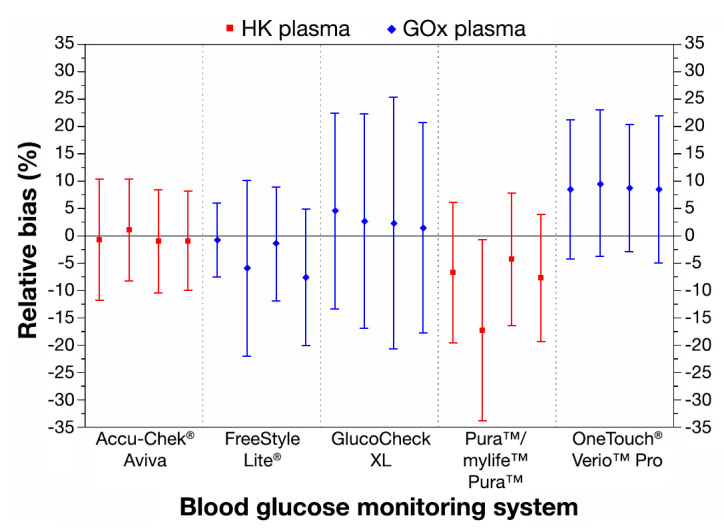
Figure 1.

Relative bias according to Bland and Altman for five BG systems, four test strip lots per system. Antennae illustrate 95% limits of agreement. For the calculation of the relative bias of each system, data of 200 blood samples (BG concentrations <50 to >400 mg/dl) were included.
