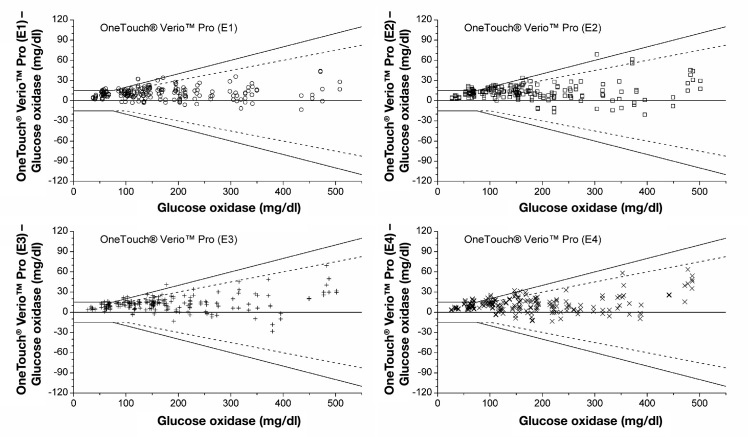
Figure 4.
Difference plots for OneTouch® Verio Pro BG system, four test strip lots per system. Solid lines illustrate the zero line and the system accuracy limits of EN ISO 15197. Dashed lines show system accuracy limits of the current draft revision of ISO 15197. ○, test strip lot 1; □, test strip lot 2; +, test strip lot 3; ×, test strip lot 4.

