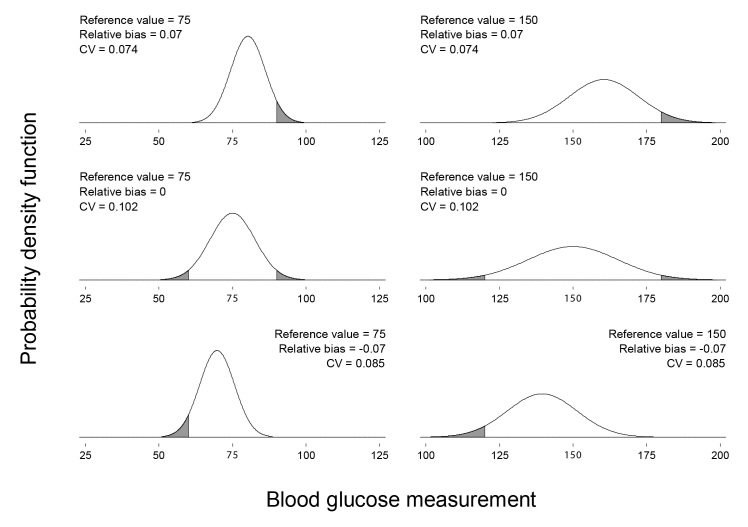
Figure 3.
Six meter measurement distributions with reldev0.95 = 0.20. The reference value, relative bias, and CV corresponding to each distribution appear above the distribution. The reference value for each distribution is also labeled in bold on the horizontal axis. The CVs have been rounded to three decimal places. The shaded area under each curve corresponds to meter measurements falling outside of zone A in Clarke’s error grid.11 The proportion of the area under each curve that is shaded is the proportion of meter measurements that would fall outside of zone A.

