
Figure 5.
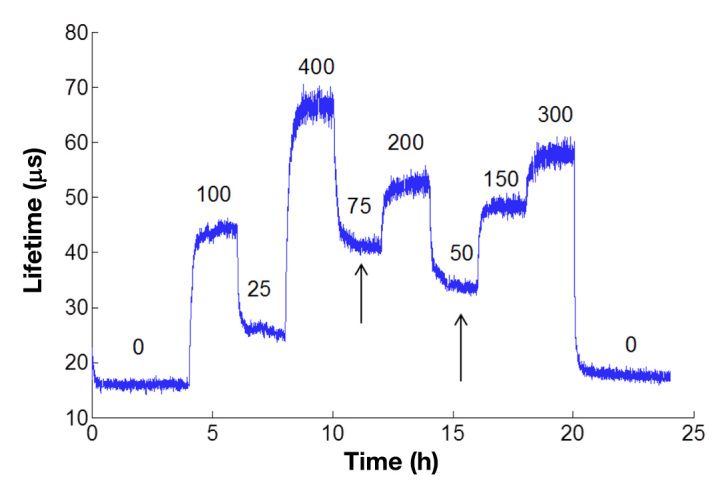
Representative real-time glucose response of serum-exposed sensors based on pHEMA hydrogels. Phosphorescence lifetime is tracked over time as different concentrations of glucose are flowed over the surface of the sensor. Numbers above the graph represent the concentration of glucose in mg/dl. After the glucose concentration is changed, the lifetime changes and approaches equilibrium (arrows). Values at each concentration were taken once steady-state signal was achieved for each concentration