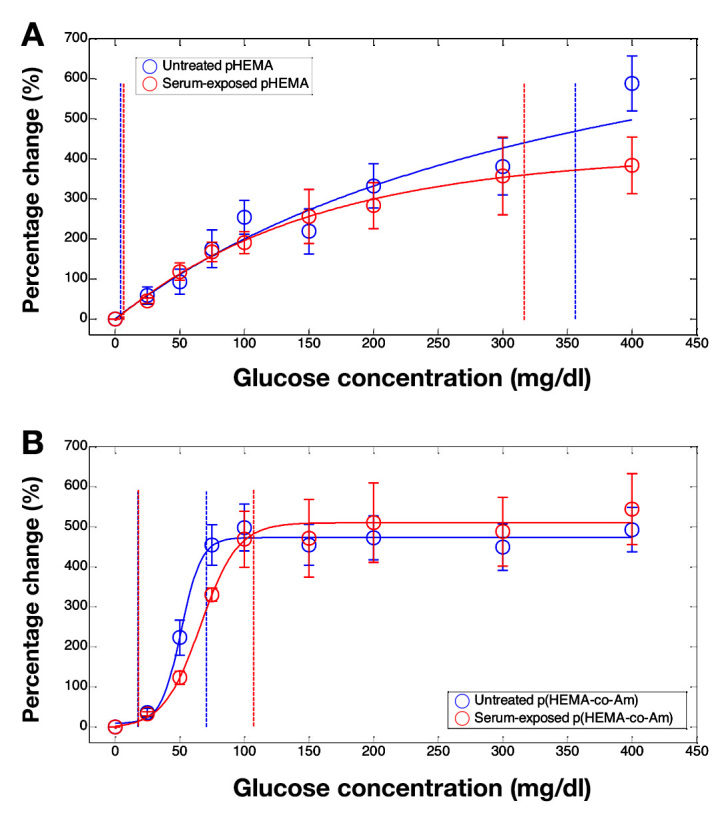
Figure 8.

Averaged response curves from separate polymer gels of (A) pHEMA and (B) p(HEMA-co-AM), before (blue) and after (red) exposure to serum. Fits of the gel average response are shown (solid lines) as well as boundaries of the analytical range (vertical dotted lines). Data are reported as percentage change in luminescence lifetime from the baseline lifetime at 0 mg/dl glucose. Error bars represent standard deviations (untreated pHEMA n = 7, serum-exposed pHEMA n = 3, untreated p(HEMA-co-AM) n = 4, and serum-exposed p(HEMA-co-AM) n = 3)
