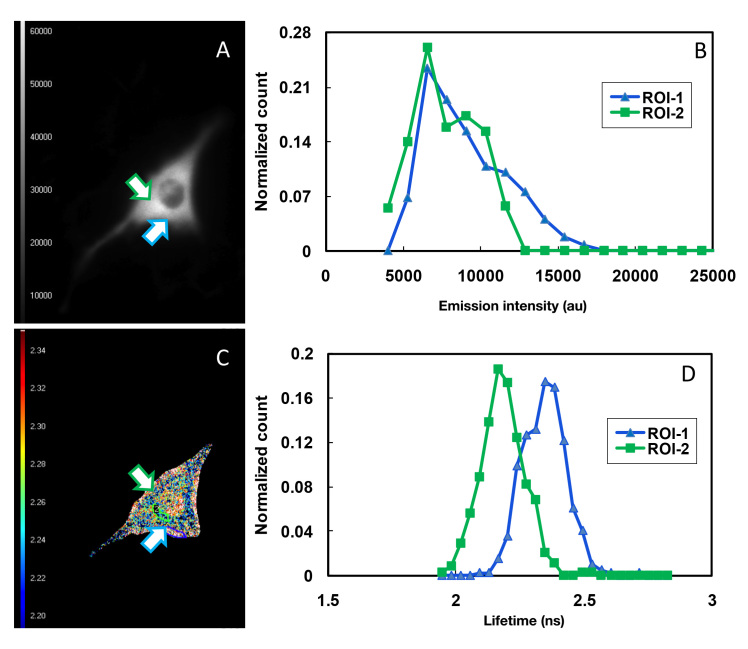
Figure 6.
FD-FLIM of glucose concentration gradients in cytoplasm of C2C12 cells. C2C12 cells were transfected with pcDNA3.1-AcGFP1-GBPcys-mCherry. FD-FLIM was performed at 24 h post-transfection in the presence of 10 mM glucose. (A) Monochromatic intensity FRET image and (C) pseudocolored lifetime map. Fluorescence intensity (B) and lifetime (D) of AcGFP1 were determined for two ROIs in a single C2C12 cell. Pseudocolor Lifetime Look-up Table: 2.20–2.34 ns

