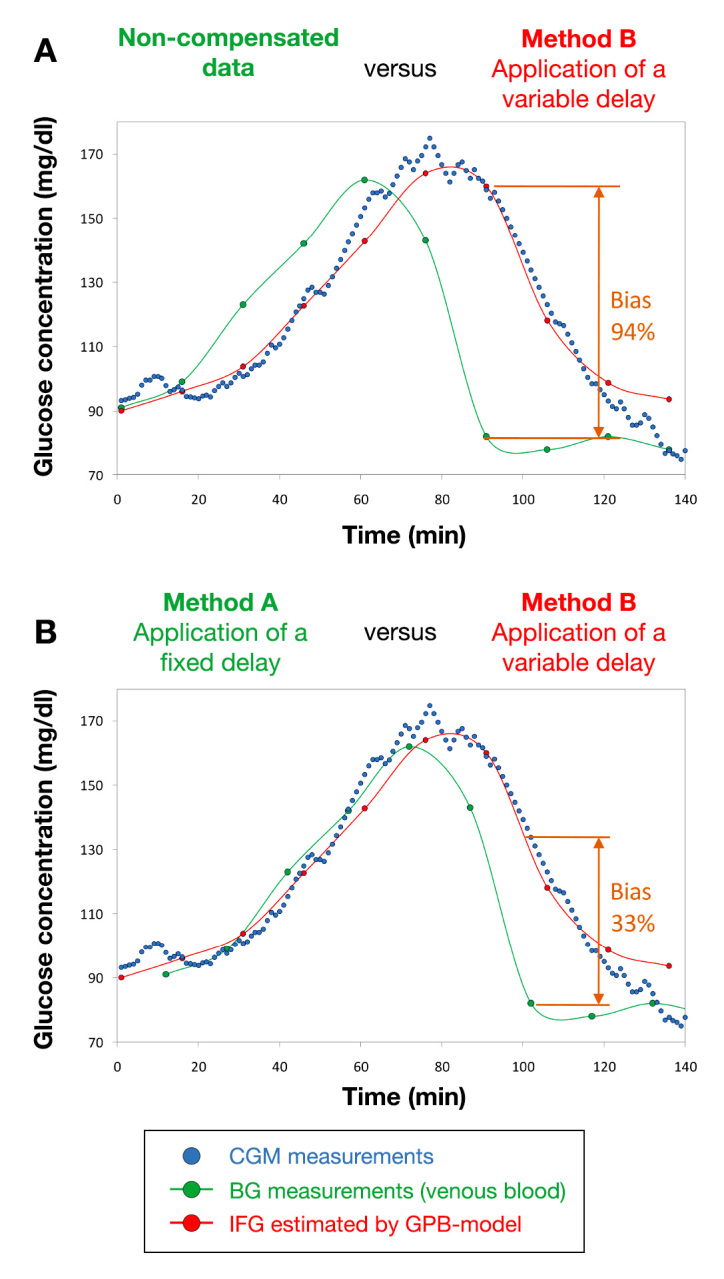
Figure 3.

Case study 1: meal tolerance test followed by using the GMD CGM system (blue dots). The green dots represent the measured reference data (VB glucose concentrations), either reported (A) according to their original timing or (B) after a rigid time shift by 11 min. The IFG values calculated in silico by means of the GPB model are shown as red dots
