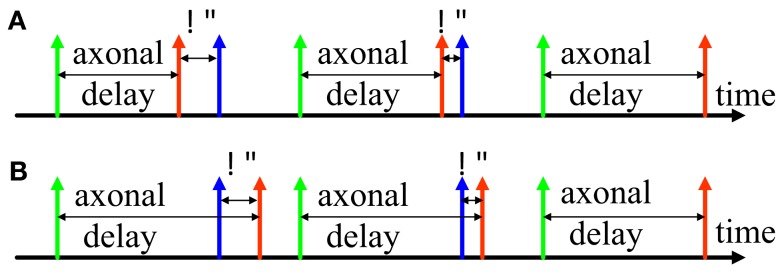
Figure 2.

Delay adaptation. (A) Illustration of delay increment; (B) Illustration of delay decrement. The green spike represents a spike generated at the pre-synaptic neuron, the red spike represents the pre-synaptic spike at the synapse, and the blue spike represents the post-synaptic spike at the neuron.
