
Figure 10.
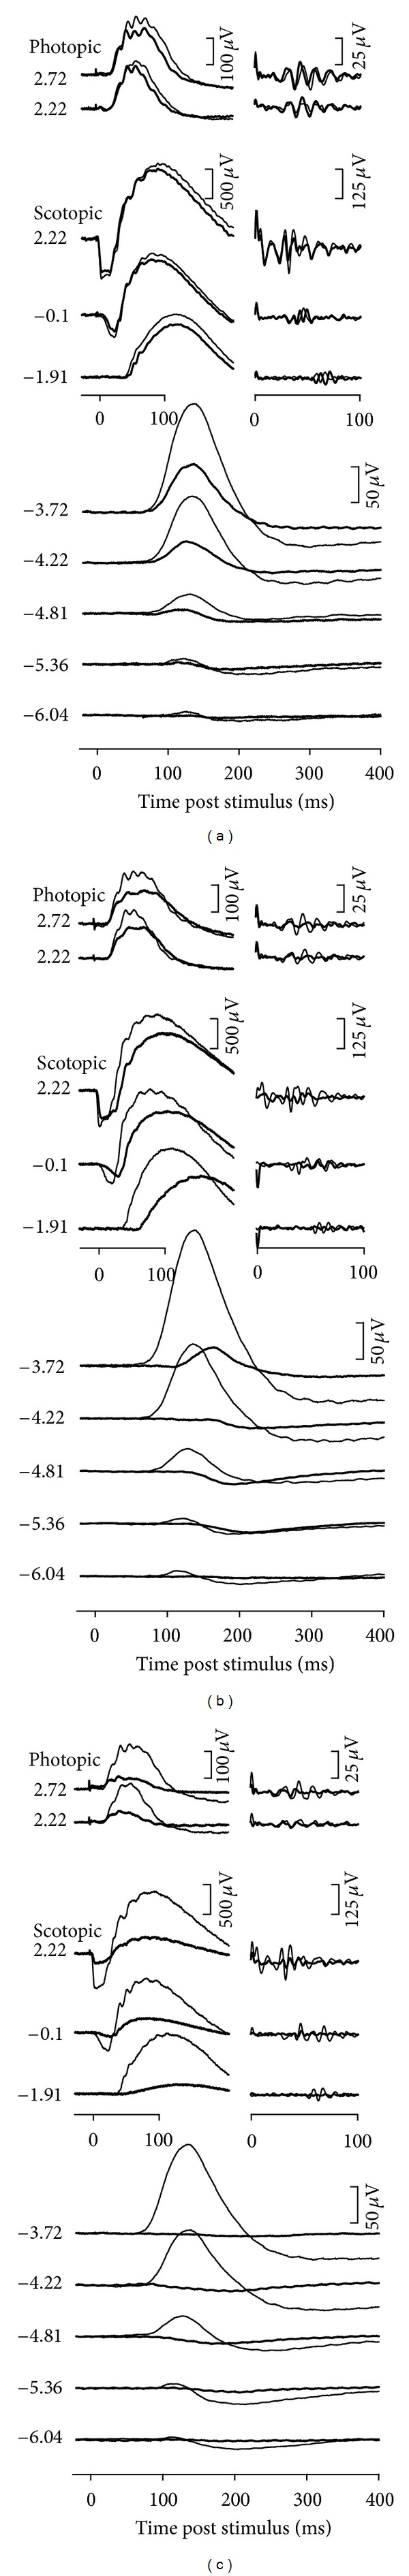
Effect of chronic IOP elevation on the rat ERG. Representative individual examples of ERG findings for experimental eyes (bold traces) and fellow control eyes (thin traces). Examples are given for eye showing mild (a), moderate (b), and high (c) IOP elevation. Stimulus flash intensities are listed at left for scotopic and photopic responses. Isolated OPs are shown to the right of corresponding waveforms. Reproduced with permission from [66].