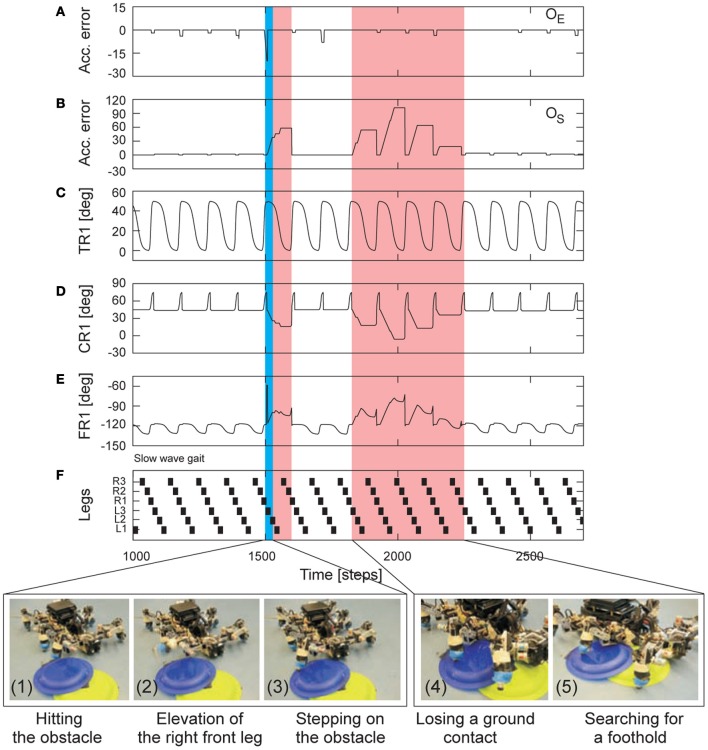
Figure 10.
Real-time data of adaptable locomotion on terrain with small obstacles. (A,B) The negative (oE) and positive (oS) accumulated errors (Figures 7B,A). They control leg adaptation to deal with stepping on or hitting obstacles during the swing phase and losing a ground contact during the stance phase. (C–E) The TC-, CTr-, and FTi-joint angles of the right front leg (R1) during walking on the floor with small obstacles (≈2.5 cm height). They represent the leg movement including adaptation. (F) Gait diagram showing a slow wave gait (MI = 0.02) of AMOS II in this experiment. Black boxes indicate swing phase while white areas between them indicate stance phase. Abbreviations are referred to Figure 1. Below pictures show snap shots of locomotion of AMOS II during the experiment. Blue and red areas indicate elevation and searching actions, respectively. Note that one time step is ≈0.037 s.

