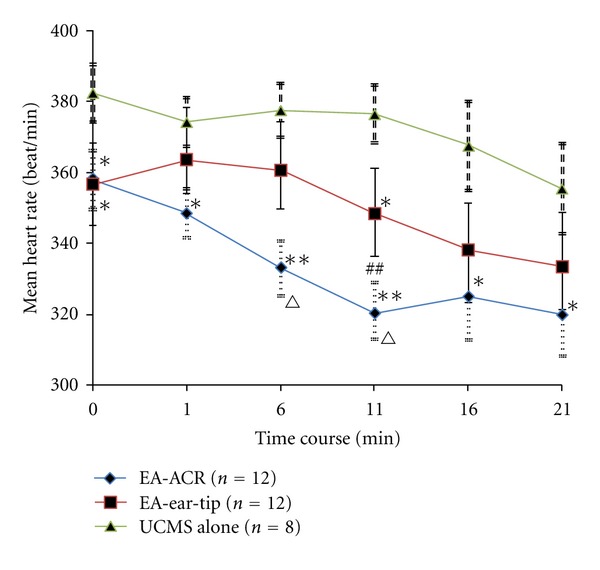
Figure 2.

The time course of heart rate for three UCMS groups during one EA treatment/anesthesia. Comparison between the EA-treated UCMS group and the UCMS alone group, *P < 0.05, **P < 0.01. Comparison between the EA-ACR group and the EA-ear-tip group, ∆ P < 0.05, ∆∆ P < 0.01. Comparison between the starting point of anesthesia and the 11th min in the EA-ACR group. ## P < 0.01.
