
Figure 3.
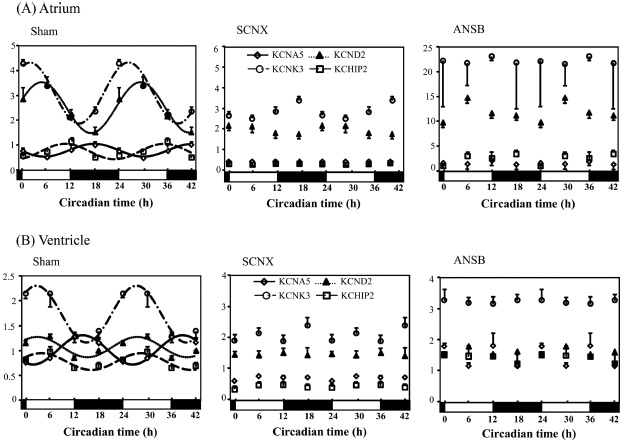
Cardiac ion channel genes expressions were similarly altered in the SCNX and ANSB mice (for each group, n = 3–6). Cardiac ion channel genes expressions in the atrium (A) and ventricle (B). All data were normalized against GAPDH and double-plotted. The solid line or dotted line indicates circadian rhythm fitted by least-squares cosine-curve fitting. Open diamonds, KCNA5; closed triangles, KCND2; open squares, KCHIP2; open circles, KCNK3. The open and closed bars under the x-axis represent the light and dark periods, respectively, in one day. All four ion channel gene expressions lost circadian rhythm in the SCNX and ANSB mice.