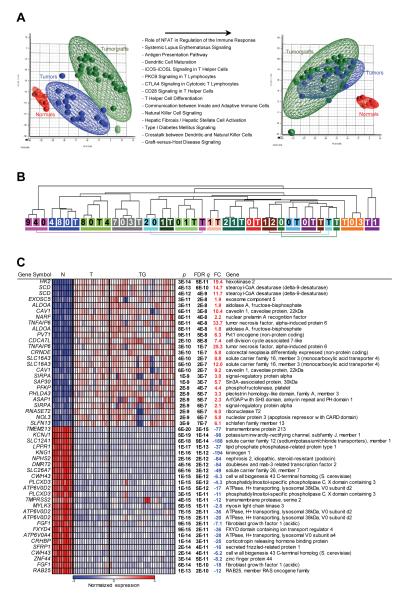
Fig. 3.
Gene expression analyses of tumors and tumorgrafts. (A) Principal component analysis of tumor, paired normal renal cortex (for a subset of tumors), and tumorgraft samples before and after subtraction of probes upregulated in tumors vs. tumorgrafts. List of top Ingenuity Pathways corresponding to transcripts upregulated in tumors over tumorgrafts with a FDR q<0.05 and a fold change greater than 1.5. (B) Unsupervised hierarchical clustering of samples according to gene expression pattern after subtraction. Each tumor/tumorgraft clade is color-coded and includes patient tumor sample (T) and the corresponding tumorgrafts (numbers reflect mouse tumorgraft cohort). (C) Heatmap of tumor-specific gene expression changes after subtraction of immune/stromal signature including the top 25 up- and down-regulated probesets in tumors compared to adjacent normal parenchyma (ranked by q value). N, normal; T, tumor; TG, tumorgraft; FDR q, false discovery rate-corrected p value; FC, fold change.

