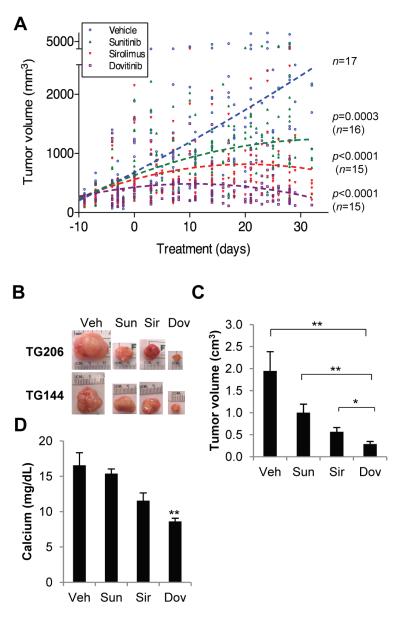
Fig. 7.
Effect of dovitinib on RCC tumorgrafts. (A) Tumorgraft volumes of mice treated with vehicle (n=17), sunitinib (n=16), sirolimus (n=15), and dovitinib (n=15). A second order polynomial quadratic regression analysis was used to generate trend lines and a linear mixed model was used for the calculation of p values respect to vehicle control. (B) Macroscopic tumorgraft images from several tumors at the end of trial. (C) Tumorgraft volumes at the end of drug trial. (D) Serum calcium levels of TG144 at the end of the trial (n=3-4 per treatment arm). Data are means + SE. *, p<0.05; **, p<0.01.

