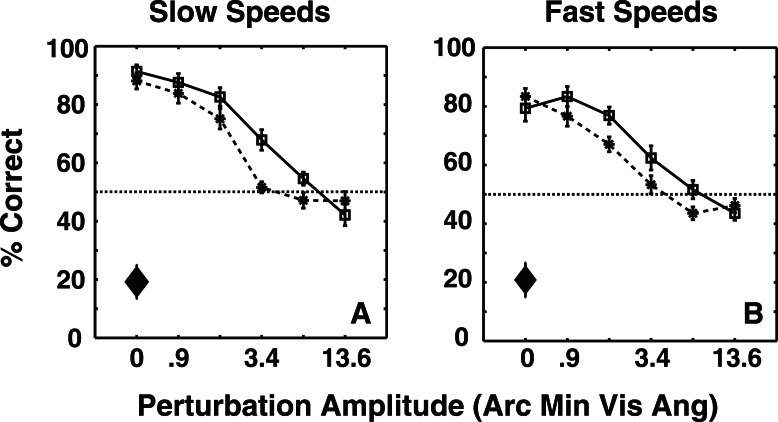
Figure 6.
Average of 10 observers' performances as a function of perturbation amplitude at slow and fast presentation rates in Experiment 2. Solid lines and dashed lines correspond to large and small shape amplitudes, respectively. The diamonds show the effects of local motion when the global shape had zero amplitude. The error bars depict the SEM. A three-way repeated measures ANOVA revealed significant effects of perturbation amplitude, F(5, 45) = 78, p < < < 0.0001, shape amplitude, F(1, 9) = 26.93, p = 0.0006, and presentation rate, F(1, 9) = 18.76, p = 0.0019. There was also a significant interaction between shape amplitude and perturbation amplitude, F(5, 45) = 6.86, p = 0.0001. Observers performed significantly below chance on the control task for both slow, t(9) = 5.41, p = 0.0006, and fast, t(9) = 5.03, p = 0.001, presentation rates.

