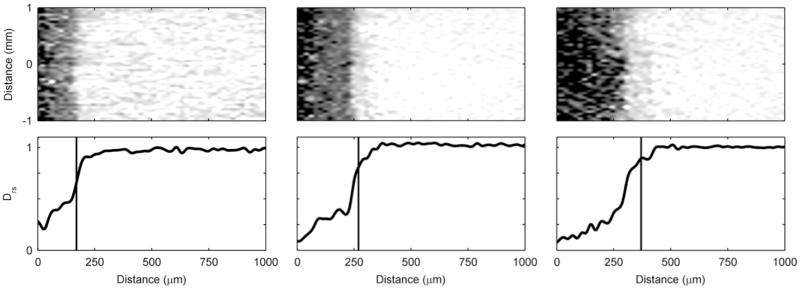
Figure 3. Diffusion mapping of a G. sulfurreducens biofilm over time.
The top row shows two-dimensional De maps obtained using PFG-NMR, normalized against Daq, of the middle 2 mm of the biofilm. The dark regions represent low De. The bottom row shows Drs depth profiles derived by averaging the De of the middle 2 mm of the biofilm (shown in the maps). The top of the biofilm as determined using magnetic resonance imaging is indicated by the vertical lines. From left to right, the panels show the G. sulfurreducens biofilm at 24, 35, and 52 days old.

