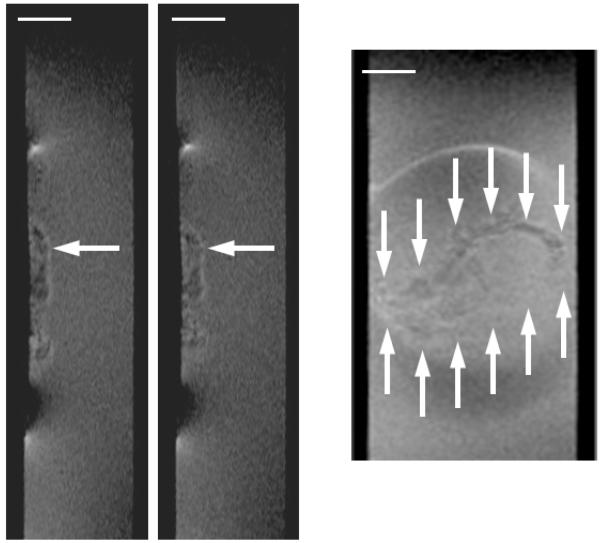
Figure 4. S. oneidensis biofilm growth.
Left) Time series of two normal-plane 2D MRI showing the progression of the growth of an S. oneidensis biofilm. The white arrows indicate the top of the biofilm. The ages shown are 12 and 16 days. In the initial image the biofilm is 410 μm thick, and in the final image the biofilm is 450 μm thick. Right) A face-plane 2D MRI of the biofilm. The white arrows indicate the edges of the biofilm on top of the electrode. A 1 mm scale bar is provided at the top of each MRI (the normal-plane and face-plane images have the identical scale).

