Figure 1.
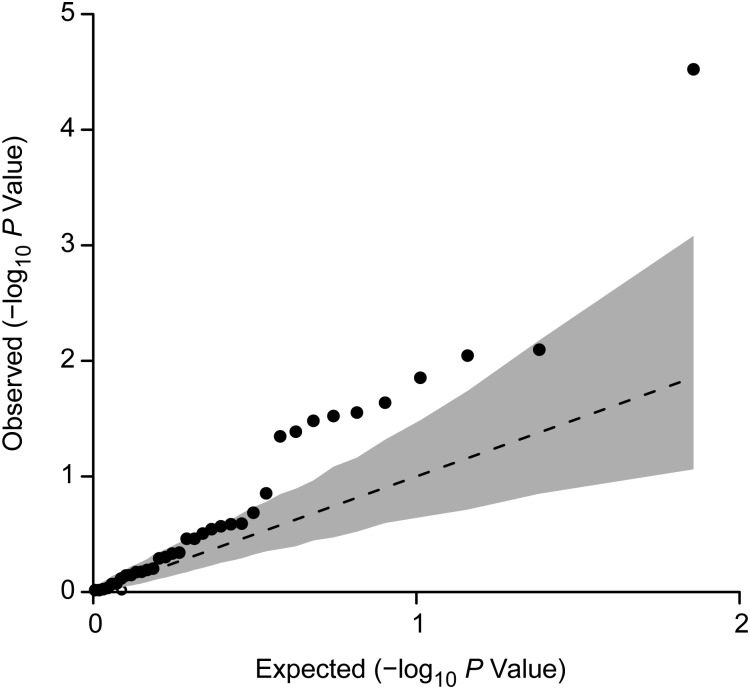
Quantile-quantile plot comparing the uniformly distributed −log10 P values for the 36 type 2 diabetes (T2D) susceptibility markers with −log10 P values observed in the Breast and Prostate Cancer Cohort Consortium data set when the authors tested for an association with prostate cancer (PCa) risk by means of a Wald test. The dotted line shows the expected −log10 P value distribution. The black points represent observed P values for the association of each T2D locus with PCa risk. The gray region is the 95% confidence interval for 10,000 permutations. The inflation index (λGC) of 1.95 is significantly elevated (P = 0.02), which indicates an overall inflation in association P values but gives no information about the directionality of association between the T2D variants and PCa risk.

