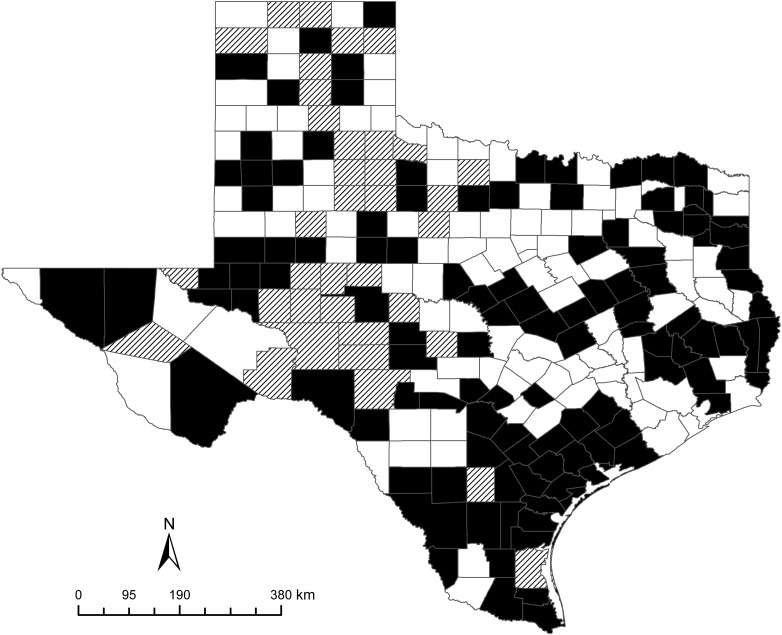
Figure 2.
County-specific asthma incidence per 100 person-years among Medicaid-enrolled children in Texas, aged 1–17 years, 2005–2007. Counties shaded in black are those with incidence above the statewide incidence rate, while those shaded in white were below the state rate. Counties with hash marks had fewer than 16 cases, and therefore incidence rates were not calculated.

